Incidence Rate Ratio
Explanations & examples: Calculate the incidence rate ratio (IRR) between two incidence rates by entering the info for each of the two groups into the table. For each of the two groups, that are
being compared, enter the events (cases) that was observed in the group throughout the time period of the study and the total trial time of all the participants in the
group. The total time is found by taking all the individual times that each of the participants in the group spent in the study and adding them together. For example, if
one person in group 1 was observed for 15 months and then got the outcome/disease, then that person adds 1 to the number of events in the group and adds 1.25 years to the
total time of the group. If a person in the group didn't get the outcome, the time he/she was in the study is added to the total time.
Calculate the incidence rate ratio (IRR) between two incidence rates by entering the info for each of the two groups into the table. For each of the two groups, that are
being compared, enter the events (cases) that was observed in the group throughout the time period of the study and the total trial time of all the participants in the
group. The total time is found by taking all the individual times that each of the participants in the group spent in the study and adding them together. For example, if
one person in group 1 was observed for 15 months and then got the outcome/disease, then that person adds 1 to the number of events in the group and adds 1.25 years to the
total time of the group. If a person in the group didn't get the outcome, the time he/she was in the study is added to the total time.
The first group is usually the exposed group (who were exposed to the exposure of interest in the study) and the second one the non-exposed. The incidence rate ratio will then be the rate of the "exposure" group divided by the rate of the "non-exposure" group. And the value of this IRR will be how many times higher (or lower) a person in the exposed group has of getting the outcome compared with a person from the unexposed group. If the value of IRR is above 1, then the exposure is a risk factor for getting the outcome (group 1 will have higher risk than group 2). If, however, the IRR is between 0 and 1, then the exposure has a preventive effect on the outcome. It can be tested with a z-test whether the IRR could be equal to 1. If the IRR is significantly different from 1 then the rates of the two groups are significantly different from each other on a five percent significance level. In other words it can be rejected that the incidence rates are the same. You can choose between the two input versions "2 × 2 table" and "raw data". If you have already calculated the number of cases in the exposed and unexposed group and added the times together in both of these groups, then the 2 × 2 table is suitable for you. If, however, you haven't done this and still have the original "raw" data in a text file; then you should choose "raw" data and either copy/paste the data into the table or make the app read the data from the file. If you have the original, raw data in a text file, you have two options when copy/pasting or uploading: If the data in your text file looks like this: 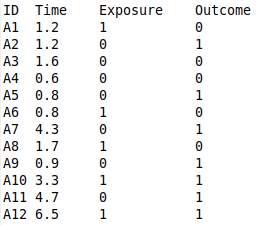 then you should click on the check option "data in file is in columns" to the right before copy/pasting into the table or reading from a data file. If, on the other hand, the data in your text file is in the following format;  then you should instead click the check mark "data in file is in rows" to the right before copy/pasting or reading from a data file. Example:In the exposed group people were exposed to heavy smog from living in a city with many polluting factories. 19 people in the group ended up getting cancer and the total person time for all the people in the group throughout the study period was 1564 years. In the unexposed group people were taken from a different city with little or no air pollution. In this group 8 people got the outcome (cancer) and the total of the times that the persons were studied was 1689 years. The incidence rate of the exposed group is 12.1483 meaning that if we took 1000 persons from the exposed group and followed them for one year, roughly 12 out of the 1000 would get the outcome. Incidence rates are usually per 1000, but this option can be changed with the "per" button above. 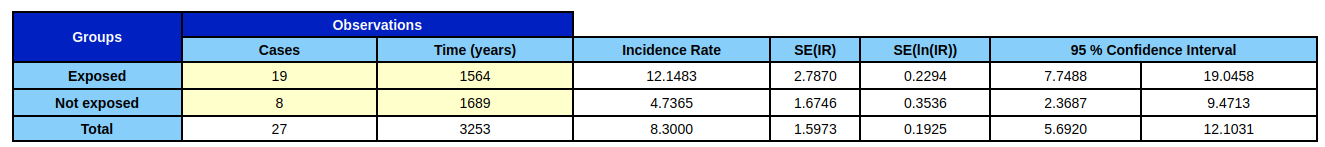
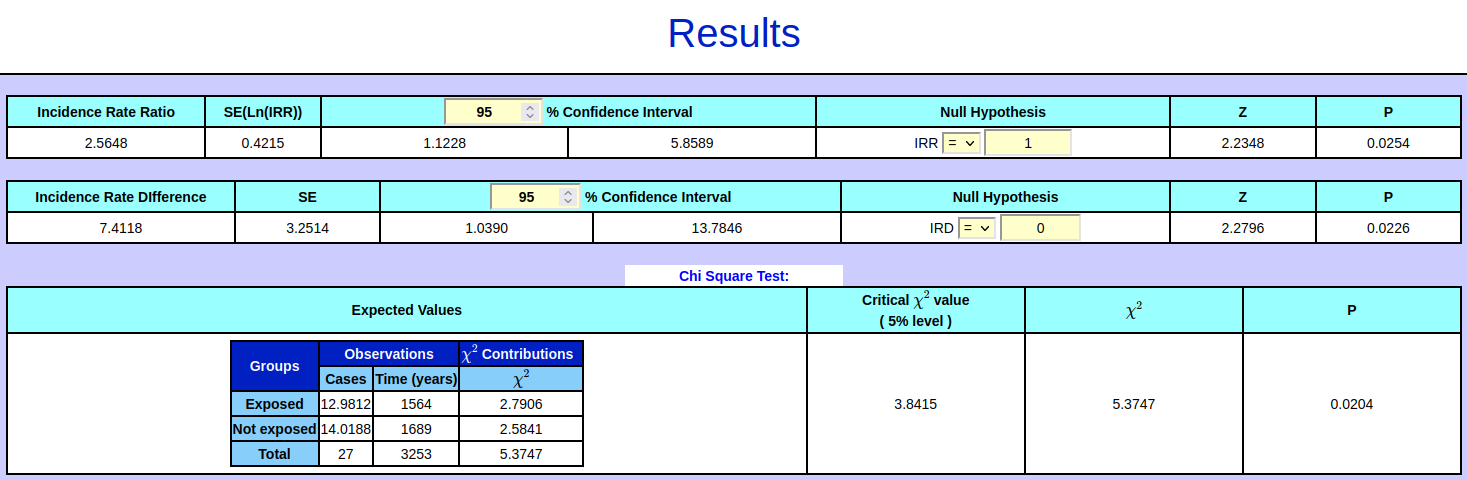
The incidence rate for the unexposed group is 4.7365 out of 1000. By comparing the two rates we first notice that neither of the rates is included in the 95 % confidence interval of the other rate, since the intervals are [7.7488 : 19.0458] and [2.3687 : 9.4713] respectively. There is, however, some overlap between the intervals. Therefore we can't in this case use the intervals alone to determine whether the two rates could be equal, but have to rely on a test to find out. If there had been no overlap in the intervals, the rates would have been significantly different from each other and we would know without making a test that the p-value would be below 5 %. If the value of one of the rates had been included in the confidence interval of the other rate, or if both rates had been included in each other's intervals, then we would know that the two rates could be assumed equal without doing a test and we would know beforehand that the p-value would be above 0.05. In the case of the example the p-value is 0.0254 which is below 0.05 and therefore we reject the null hypothesis H0, namely that the ratio of the rates (the IRR), i.e the number 2.5648, could be equal to 1. An IRR of 1 (or not significantly different from 1) would have meant that there hadn't been a significant difference between the rates. Having rejected this we conclude that there is a significantly higher risk of getting cancer if you were in the exposed group compared to if you had been in the non-exposed group. The risk of getting cancer is 2.5648 times higher in the exposed group compared with the unexposed group in this fictive, made up example. Instead of the IRR we could also have used the incidence rate difference (IRD), i.e. the second rate subtracted from the first, to test the hypothesis that the two rates are equal. In this case we would test the null hypothesis H0: IRD = 0. A third option would be to use the chi-squared test to test whether the two rates could be equal. In the chi-squared test the observed values are compared with the expected values (that we would have observed if H0 had been true). The p-values in the three tests usually differ only slightly. Apart from testing whether the two rates could be the same (by testing either H0: IRR = 1 or H0: IRD = 0) you can also test the hypothesis that for eg. the first rate is twice as big the second one. This is done by entering IRR = 2 in the input field of H0. Also in this case H0 is rejected on a five percent significance level if p < 0.05. For more info about the incidence rates and formulas used in the calculations, please see the page medical statistics formulas. |
|
Per: |
Decimals:
|
||||||||||||||||||||||||||||||||||||||||
|
|||||||||||||||||||||||||||||||||||||||||||